
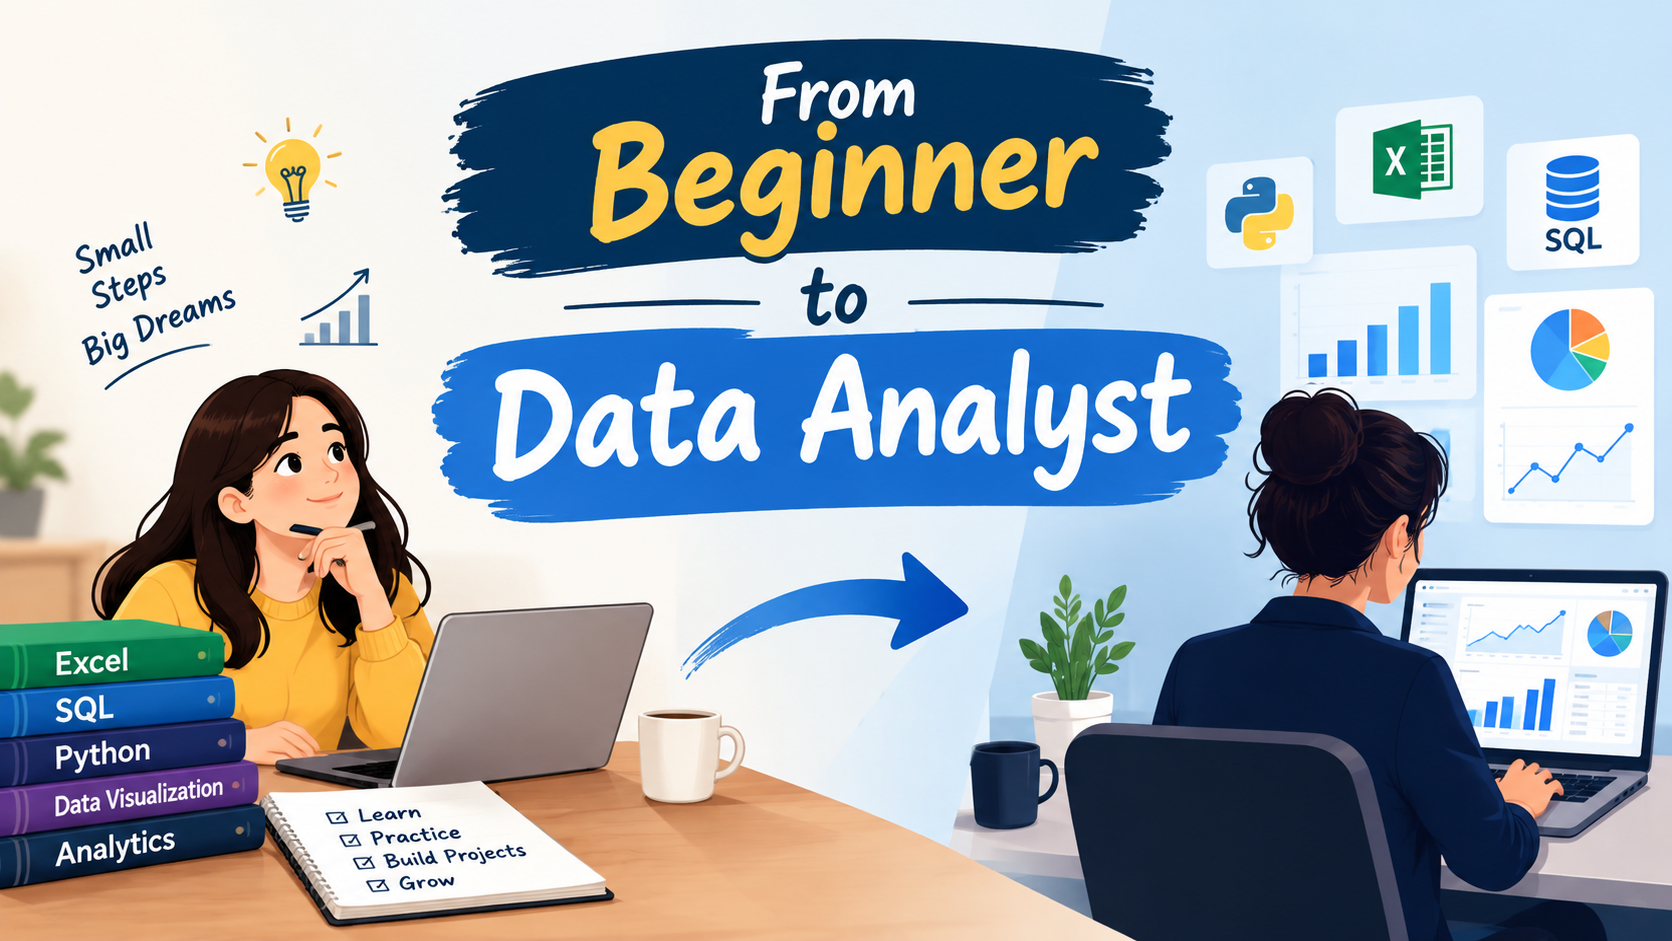
From Beginner to Data Analyst
How I’m Building My Data Analytics Skills as a First-Year B.Tech CSE Student
Starting B.Tech in Computer Science and Engineering made me realize something very quickly:
There are almost too many things to learn.
Programming. Databases. Web development. Artificial intelligence. Cybersecurity. Cloud computing. Data science. Machine learning.
When I first started exploring the technology field, I found myself asking a simple question:
“Where should I actually start?”
Instead of trying to learn everything at once, I decided to choose one area, build a strong foundation, and gradually expand my skills.
For me, that area is Data Analytics.
I am still at the beginning of this journey. I don't consider myself a data analyst yet. I am a student learning the fundamentals, experimenting with tools, and trying to understand how data can be transformed into meaningful information.
This blog is about why I chose Data Analytics, what I am learning, how I plan to learn it, and what I hope to achieve during my B.Tech journey.
Why Did I Choose Data Analytics?
The first question someone might ask is:
Why Data Analytics when I am studying Computer Science?
For me, the answer is curiosity.
Every day, companies generate enormous amounts of data.
Customer transactions.
Website visits.
Sales records.
Social media interactions.
Product reviews.
Financial information.
Student performance.
Almost everything can generate data.
But raw data by itself isn't very useful.
The real value comes from being able to understand that data.
What is happening?
Why is it happening?
What patterns can we find?
What might happen next?
And most importantly:
What decision should we make based on the data?
That's what attracted me to Data Analytics.
I like the idea of combining technology, mathematics, problem-solving, and business thinking to answer real-world questions.
I Don't Want to Just Collect Certificates
One thing I have realized early in my learning journey is that certificates alone don't create skills.
It is very easy to complete an online course, download a certificate, and move on to the next course.
But after a few months, you may realize that you don't actually remember how to apply what you learned.
I want to approach learning differently.
My goal is:
Learn → Practice → Build → Share → Improve
Instead of asking:
“How many certificates can I complete?”
I want to ask:
“What can I actually build with what I have learned?”
That's why projects will be an important part of my journey.
Step 1: Building the Foundation
Before jumping directly into complicated tools, I decided to understand the fundamentals first.
I believe this is one of the most important steps.
If you don't understand what you're doing, learning a tool becomes nothing more than memorizing buttons and commands.
The foundation includes understanding concepts such as:
What is data?
What is structured and unstructured data?
What is Data Analytics?
Types of Data Analytics
Data collection
Data cleaning
Data visualization
Exploratory Data Analysis
Basic statistics
Business questions and KPIs
How analytical insights support decision-making
These concepts may sound simple, but they provide the foundation for everything that comes later.
I have recently completed my initial foundation stage, and now I am moving toward hands-on tools.
And my first major tool is Excel.
Step 2: Learning Excel
When people hear "Data Analytics," they often immediately think about Python, AI, or Machine Learning.
But I decided not to rush.
I started with Excel.
Why?
Because Excel provides an approachable way to understand how data works.
While learning Excel, I am focusing on things such as:
Data entry and organization
Sorting and filtering
Formulas and functions
Conditional formatting
Data cleaning
Charts
Pivot Tables
Lookup functions
Basic data analysis
Creating dashboards
The goal isn't simply to learn Excel functions.
The goal is to understand how to take a messy dataset and turn it into something useful.
For example, imagine having thousands of sales records.
Instead of looking at individual rows, I want to be able to answer questions like:
Which product sells the most?
Which month generated the highest sales?
Which category is performing poorly?
Which location has the highest revenue?
Are sales increasing or decreasing?
What patterns can we find?
That is where analytics starts becoming interesting.
Step 3: Statistics
After Excel, I want to strengthen my understanding of statistics.
This is an area I don't want to skip.
Data Analytics is not just about creating attractive charts.
You need to understand what the numbers actually mean.
Some of the topics I plan to study include:
Mean
Median
Mode
Range
Variance
Standard deviation
Percentages
Probability
Distributions
Correlation
Basic hypothesis testing
I don't want to learn statistics purely for examinations.
I want to understand how these concepts are used when analyzing real data.
For example, an average alone may not tell the complete story.
Two datasets can have the same average but completely different distributions.
Understanding statistics helps an analyst look beyond the surface.
Step 4: SQL
After becoming comfortable with Excel and statistics, my next major target is SQL.
SQL is extremely important because a huge amount of business data is stored in databases.
Instead of working only with a spreadsheet, SQL allows us to retrieve and analyze information from databases.
I plan to learn:
SELECT
WHERE
ORDER BY
GROUP BY
Aggregate functions
JOINs
Subqueries
CASE statements
Common Table Expressions
Window functions
At first, SQL might look like another programming language.
But gradually, I am beginning to understand that it is really a way of asking questions from data.
For example:
“Show me the top-performing products.”
“Calculate total sales for each month.”
“Which customers have purchased more than once?”
These are business questions that can be translated into SQL queries.
That's what makes SQL so powerful.
Step 5: Power BI and Tableau
Once I have a stronger understanding of data and SQL, I want to move into data visualization and business intelligence.
My plan includes learning tools such as:
Power BI
Tableau
The purpose isn't just to create colorful dashboards.
A good dashboard should help someone understand a problem quickly.
For example, imagine a business manager opening a dashboard and immediately seeing:
📈 Revenue trend
📊 Best-selling products
👥 Customer growth
🌍 Regional performance
⚠️ Underperforming categories
That is much more useful than giving them a spreadsheet containing thousands of rows.
I want to learn how to turn data into clear visual stories.
Step 6: Python
Python is another major part of my roadmap.
Since I am studying CSE, learning programming is already important for my academic journey.
For Data Analytics, I want to eventually use Python for:
Data manipulation
Data cleaning
Exploratory Data Analysis
Automation
Visualization
The libraries I plan to explore include:
NumPy
Pandas
Matplotlib
Seaborn
Python will allow me to work with larger datasets and automate tasks that would be difficult to perform manually.
It will also create a bridge between my Data Analytics journey and my future exploration of AI and Machine Learning.
My Long-Term Goal: Connecting Analytics With AI
I don't want my learning journey to stop at traditional Data Analytics.
Once I become comfortable with the fundamentals, I want to explore:
Artificial Intelligence and Machine Learning.
This is one reason I chose Data Analytics as my starting point.
Before building complex machine-learning systems, I want to understand data properly.
Because machine learning depends heavily on data.
If the data is poor, the results can also be poor.
So my long-term roadmap looks something like this:
Data Analytics → Advanced Analytics → AI/ML → Business Intelligence
I am not trying to learn everything immediately.
I want to build one layer at a time.
Projects: Where Learning Becomes Real
One of the biggest things I want to focus on is projects.
Watching tutorials can teach you concepts.
Courses can provide structure.
But projects force you to actually use what you know.
For example, after learning Excel, instead of immediately jumping to another course, I want to create a project using Excel.
Some possible projects include:
Sales Analysis Dashboard
Analyze sales data to find:
Revenue trends
Top products
Monthly performance
Regional sales
Customer patterns
Student Performance Analysis
Analyze student data to understand:
Average marks
Subject-wise performance
Attendance patterns
Performance trends
E-commerce Analysis
Analyze an online store dataset to discover:
Best-selling products
Customer behavior
Revenue trends
Product categories
Order patterns
The important thing is that a project should answer a real question.
I don't want to build projects just because they look good on a resume.
I want them to demonstrate that I can take data, analyze it, find insights, and communicate those insights.
Sharing My Learning Journey
Another important part of my journey is sharing what I learn.
I have started documenting my learning on platforms such as LinkedIn and through blogging.
Initially, I wondered:
“Why would anyone want to read about a beginner learning something?”
But then I realized that learning doesn't have to be shared only after becoming an expert.
There are many students who are at the same stage.
Someone starting today might find my experience useful.
Someone who is slightly ahead might give me advice.
And someone experienced might point out something I haven't considered.
So instead of waiting until I become an expert, I want to document the journey itself.
My posts may include:
What I learned
Interesting concepts
Projects
Mistakes
Challenges
Useful resources
Progress updates
This also gives me a reason to reflect on what I am actually learning.
The Biggest Challenge: Managing Everything
Being a B.Tech student while learning additional skills isn't always easy.
There are college classes.
Assignments.
Lab work.
Examinations.
Programming practice.
And then there are the skills I want to learn outside the syllabus.
Sometimes it can feel overwhelming.
There are thousands of courses online, hundreds of technologies to explore, and countless people sharing their success stories.
It becomes very easy to think:
“I am already behind.”
But I am trying to remind myself that I don't need to learn everything at once.
I only need to keep moving forward.
One concept.
One tool.
One project.
One day at a time.
My Learning Philosophy
At this stage of my journey, I am trying to follow a simple rule:
Don't chase everything. Build depth first.
I could start learning five different technologies simultaneously.
But that would probably leave me knowing a little about everything and being good at nothing.
Instead, I want to focus on one stage at a time.
For example:
Foundation → Excel → Statistics → SQL → Power BI/Tableau → Python → Projects → AI/ML
This roadmap will probably change as I learn more.
And that's okay.
A roadmap isn't a prison.
It's a direction.
What I Want to Achieve During B.Tech
By the time I complete my B.Tech, I don't want my biggest achievement to simply be having a degree.
I want to look back and see a collection of things I built and learned.
My goals include:
Strong programming fundamentals
Good understanding of Data Analytics
Strong SQL skills
Excel proficiency
Power BI/Tableau experience
Python for data analysis
Multiple real-world projects
A strong GitHub portfolio
A professional LinkedIn presence
Technical blogging experience
Internship experience
Exposure to AI and Machine Learning
Most importantly, I want to develop the ability to learn new technologies independently.
Because technology will continue changing long after I graduate.
The ability to learn may ultimately be one of the most valuable skills I can develop.
I Am Still a Beginner
I want to make one thing clear.
I am not a Data Analyst yet.
I am a first-year B.Tech CSE student who has chosen Data Analytics as one of the areas I want to explore seriously.
There is still a lot I don't know.
There will be mistakes.
There will be difficult concepts.
There will probably be times when I feel stuck.
But I think that's exactly what makes the journey worth documenting.
I don't want to pretend that I already know everything.
I want to show what it actually looks like to start from the beginning and gradually build skills.
Final Thoughts
My Data Analytics journey has only just started.
I began with the fundamentals, and now I am moving toward Excel. From there, I plan to gradually learn statistics, SQL, visualization tools, Python, and eventually AI and Machine Learning.
I know this roadmap won't be completed in a few weeks or even a few months.
It may take years.
And that's okay.
I'm not trying to become an expert overnight.
I'm trying to become a little better than I was yesterday.
For me, the journey is simple:
Learn. Practice. Build. Share. Improve. Repeat.
This is only the beginning of my B.Tech journey, and I'm excited to see where these skills take me.
Maybe one day I'll look back at this blog and realize how far I've come.
Until then, it's time to keep learning. 🚀
This is Day 1 of building my Data Analytics journey.


